“Suppose you’re on a game show, and you’re given the choice of three doors: Behind one door is a car; behind the others, goats. You pick a door, say No. 1, and the host, who knows what’s behind the doors, opens another door, say No. 3, which has a goat. He then says to you, “Do you want to pick door No. 2?” Is it to your advantage to switch your choice?” source: Wikipedia
Would you stick to your first choice, hoping there is a car behind it, or switch to other door proposed by the host (Monthy)? Well, the initial guess would be to stick to your first choice right? But, is that really best possible choice? How can you be sure about it? Well, one way of proofing the best possible decision is by simulating the game. Simulation in this context means to repeat the game as many times as possible and to draw a conclusion, or to keep repeating until a value of loosing and/or winning converges to a stable value.
Just a bit off the topic…
If you think that the humans have a good intuition for statistics, I would warmly recommend the following read. .

There are many ways to implement this kind of simulation. One possibility is to do some probabilistic programming with PyMC3. I have chosen to do it with pure Python and to visualize the outcomes with Plotly.
Monty Hall simulation is a probabilistic class of problem. Figure below is a good (statistical) description of it.

The figure above tells us that we have 2/3 chances of winning a car if we change our initial choice. But we would like to know the general effect of sticking to the initial choice and changing doors after some few hundreds or even few thousands of game plays. What is really best possible decision? Well here comes the Python into play.
def simulate(iter_nr):
    # init doors with 2 goats and a car
    doors = ["goat"] * 2 + ["car"]
    # init wins and loses variables
    change_wins = 0
    change_loses = 0

    # dict for holding simulation results
    data_holder = {}

    for i in range(1,iter_nr+1):

        # shuffle doors
        random.shuffle(doors)
        # pick door n:
        n = random.randrange(3)
        # monty picks door k,
        # which is different then n k!=n
        # and do not contain car doors[k]!="car"
        sequence = range(3)
        random.shuffle(sequence)
        for k in sequence:
            if k == n or doors[k] == "car":
                continue

        # now if you change,
        # you lose if door n initially chosen contains a car
        # doors[n]=="car"
        if doors[n] == "car":
            change_loses += 1
        # otherwise you win
        else:
            change_wins += 1

        total = (change_wins + change_loses)
        pwins = (100.0*change_wins)/total
        ploses = (100.0*change_loses)/total

        # update data_holder with current values
        data_holder[i] = [change_wins, change_loses, pwins, ploses]

    return data_holder
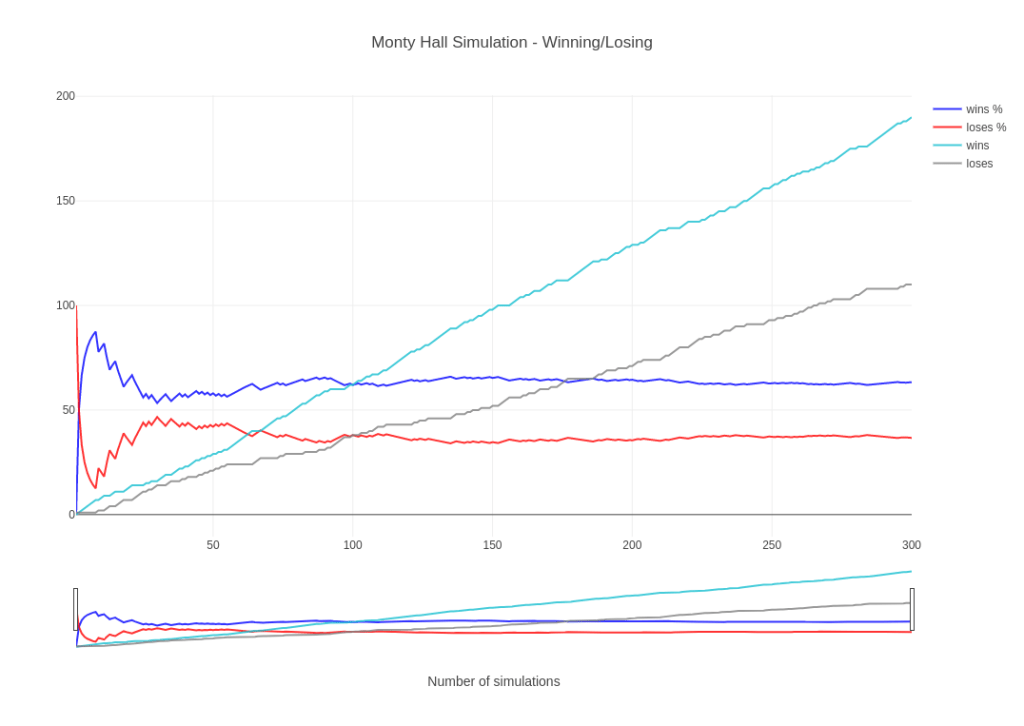
If you run the simulation few hundred times like this
data_holder = simulate(300)
and plot the outcomes with Plotly like this:
trace_high1 = go.Scatter(
    x=df.index,
    y=df['wins'],
    name = "wins",
    line = dict(color = '#17BECF'),
    opacity = 0.8)

trace_low1 = go.Scatter(
    x=df.index,
    y=df['loses'],
    name = "loses",
    line = dict(color = '#7F7F7F'),
    opacity = 0.8)

trace_high = go.Scatter(
    x=df.index,
    y=df['pwins'],
    name = "wins %",
    line = dict(color = '#0000FF'),
    opacity = 0.8)

trace_low = go.Scatter(
    x=df.index,
    y=df['ploses'],
    name = "loses %",
    line = dict(color = '#FF0000'),
    opacity = 0.8)

data = [trace_high,trace_low, trace_high1, trace_low1]

layout = dict(
    title='Monty Hall Simulation - Winning/Losing',
    xaxis=dict(
        title = "Number of simulations",
        rangeselector=dict(
            buttons=list([
                dict(count=1,
                     label='1m',
                     step='month',
                     stepmode='backward'),
                dict(count=6,
                     label='6m',
                     step='month',
                     stepmode='backward'),
                dict(step='all')
            ])
        ),
        rangeslider=dict()
        #type='date'
    )
)

fig = dict(data=data, layout=layout)
plotly.plotly.iplot(fig, filename = "MontyHall-Simulation")
You get a really nice interactive Plotly plot shown below:
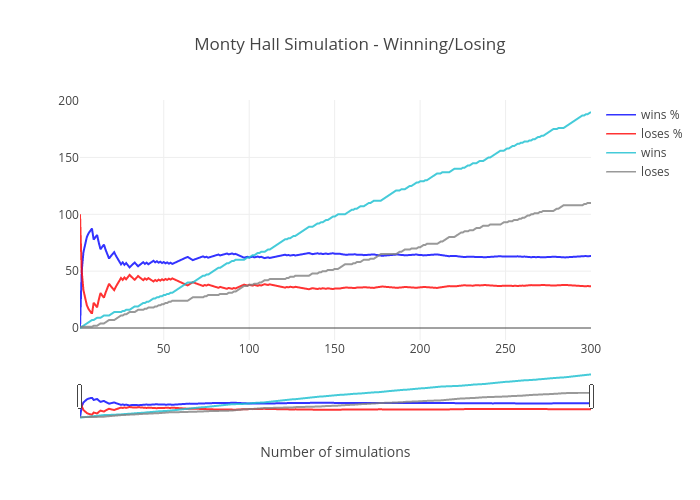
So guys, If you get to play in the Monty Hall game, I would really decide not to stick with my initial decision and to change doors. If you change you get 2/3 chance to win the grand price.
Check out the complete notebook here.
Cheers!

Leave a comment