
There is a life beyond regression analysis! You can do so much more with pure time-series data!
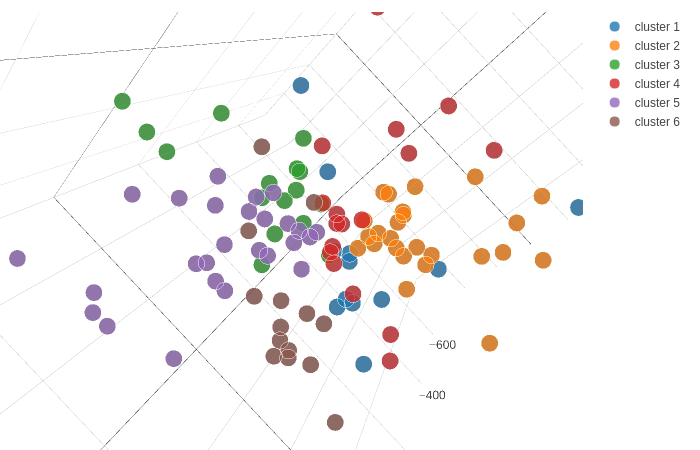
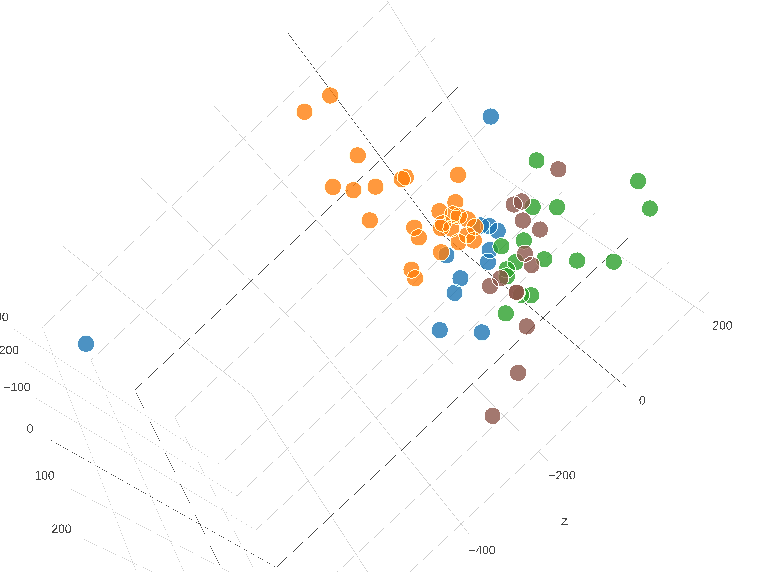
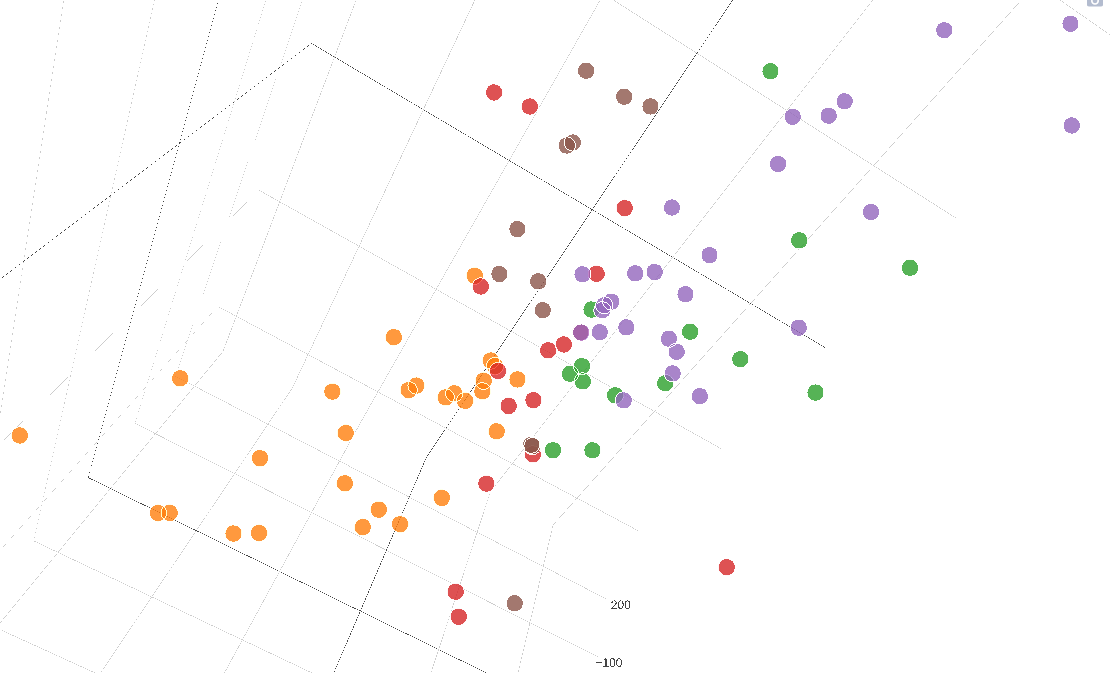
Some while ago I asked myself what could be learned about Viennese 3 star hotels from a bunch of time-series data. I applied some machine learning techniques, including multidimensional scaling and k-means clustering with “almost” ad hoc knee point, and finally visualized results with plotly in 3D. If you look deep enough, alone this type of analysis provides some interesting insights. Adding additional data for hotels, and maybe putting additional hotels to analysis is surely way to go if you want to go deeper and get lost in the world of data analysis.
Check out the plot here or by clicking at the image below. Cheers!

Leave a comment