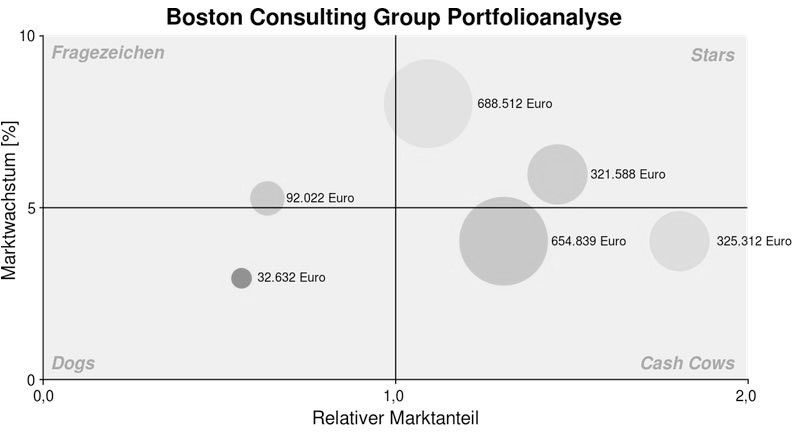
Recently, I had to make a Boston Consulting Group Matrix for a Strategic Management Class. I started off by doing everything in Python (Product-line growths etc.) and wanted to make a nice plot, but, plotting BCG Matrix in Python is a bit overhead and I switched to QlikView eventually, which I wanted to try out for a long time anyway.
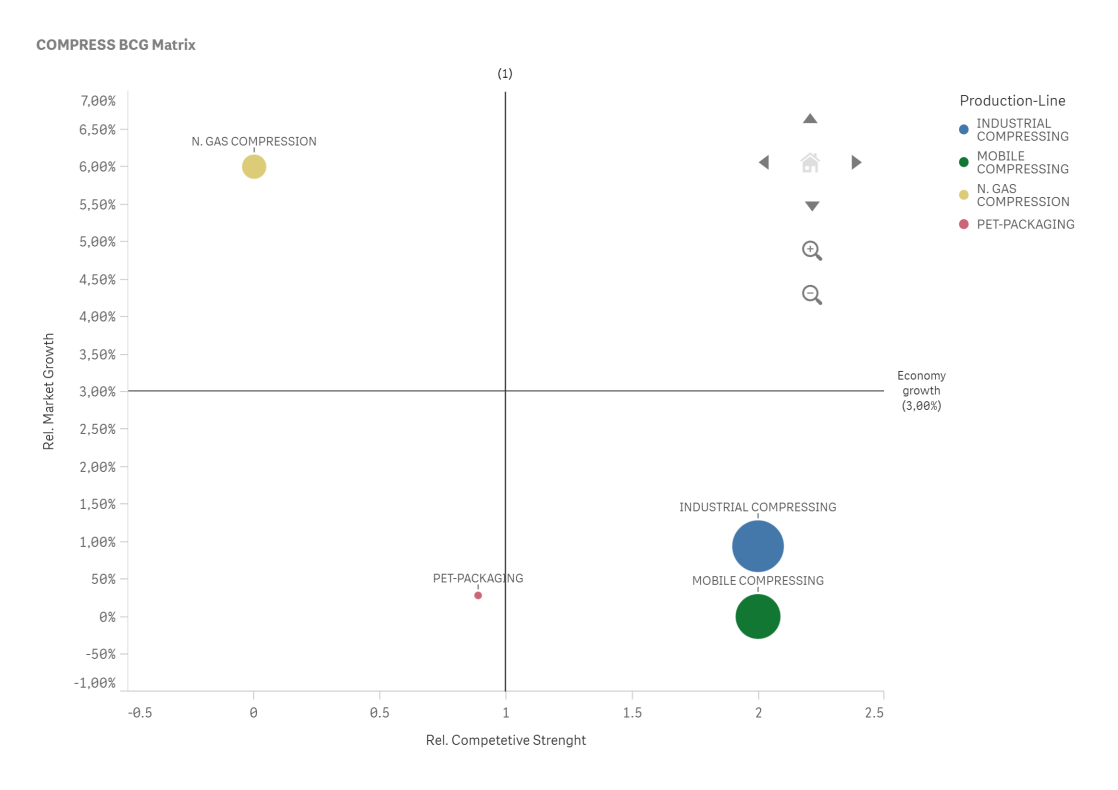
Nuff’ sad, here is the BCG Matrix in QlickView:

Leave a comment