Visualization
-
Coronavirus (COVID-19) outbreak brought the world economy and the stock market to their knees. Many people and most companies are fighting to survive these hard times. On the other hand, some are using this situation to make huge profits. In this experiment I demonstrated how to make over 80% gains, while the stock market is…
-
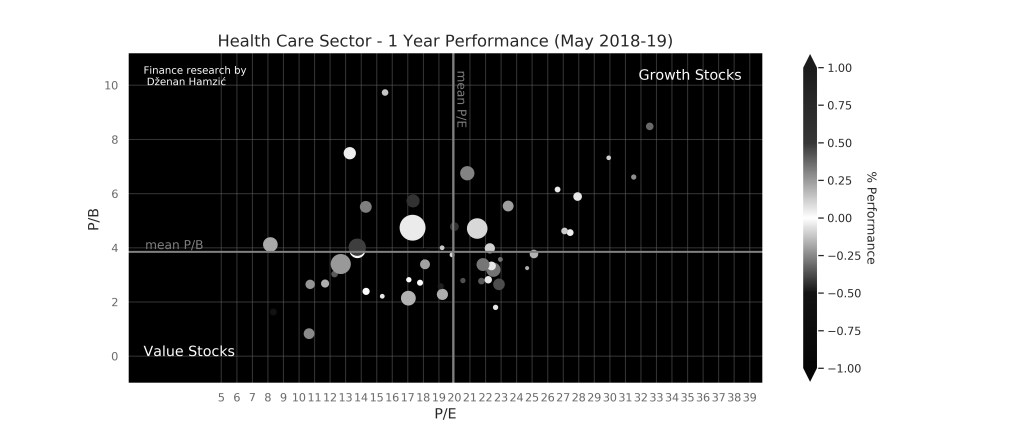
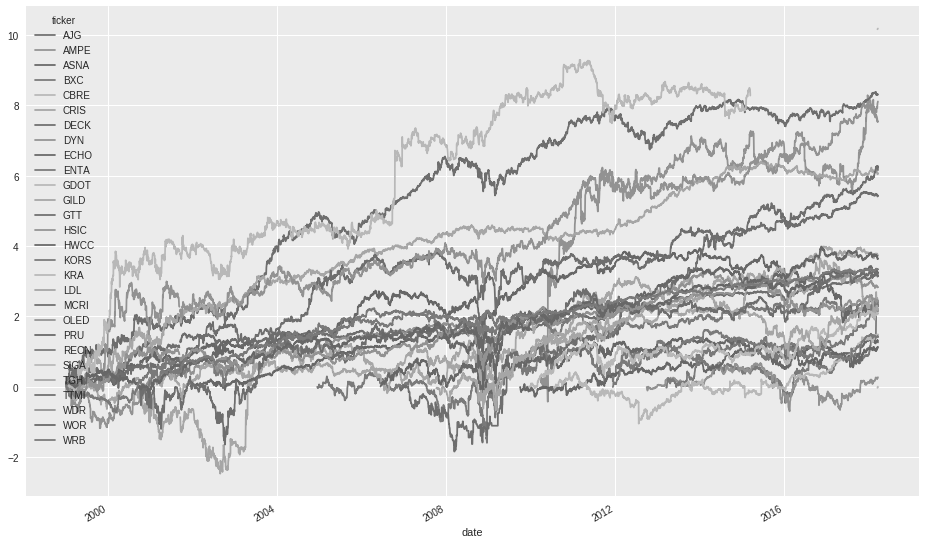
I always asked myself how to visualize stock performance by sector properly. It is a fact that Visualization is underrated in the field of Quantitative Finance. So here is my contribution to the Visualization Techniques for Quantitative Finance.
-
It all starts with a single neuron! Or with a perceptron. Perceptron is a neuron’s computational model. If you link some of them together, you get to a real ‘artificial brain’ capable of learning complex stuff. When I try to explain basic AI concepts to non computer scientist, I usually start like this … You…
-
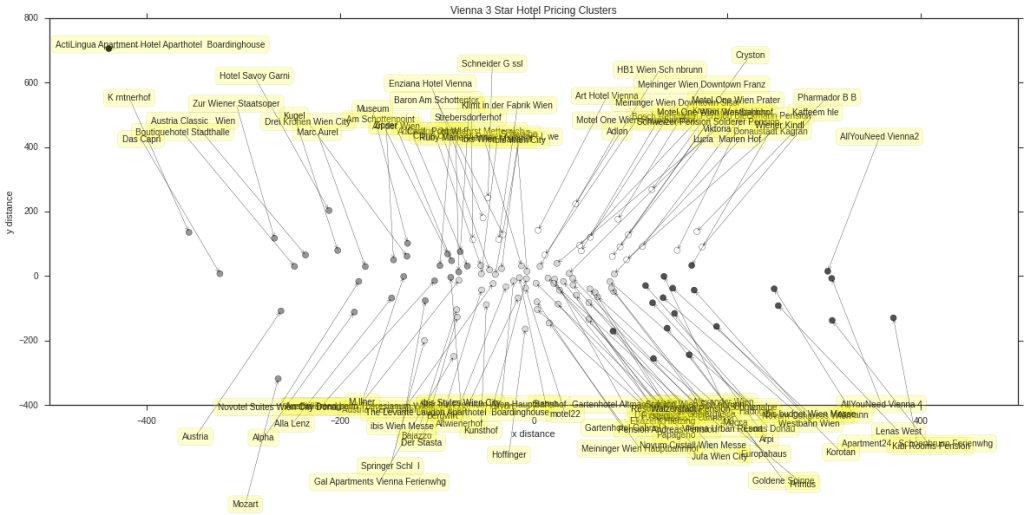
When I do not deal with people, machines or numbers, I enjoy the pleasures of data visualizations. #VisualThinking #DataScience #Python
-
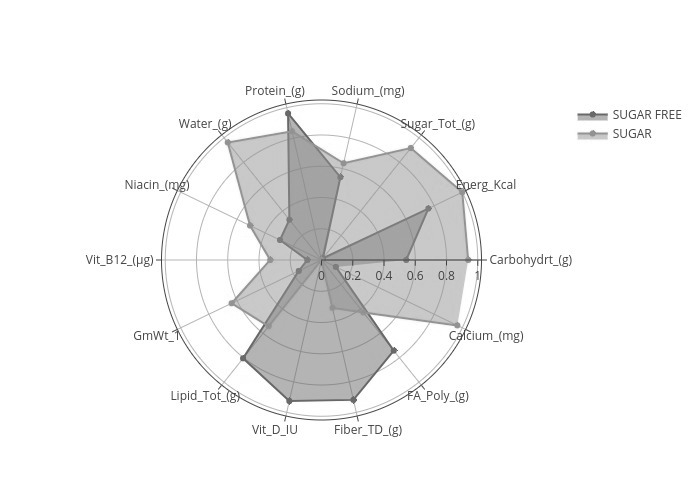
I love plotting data and learning from the visualizations. Here are some new data plots of projects I was working on lately.
-
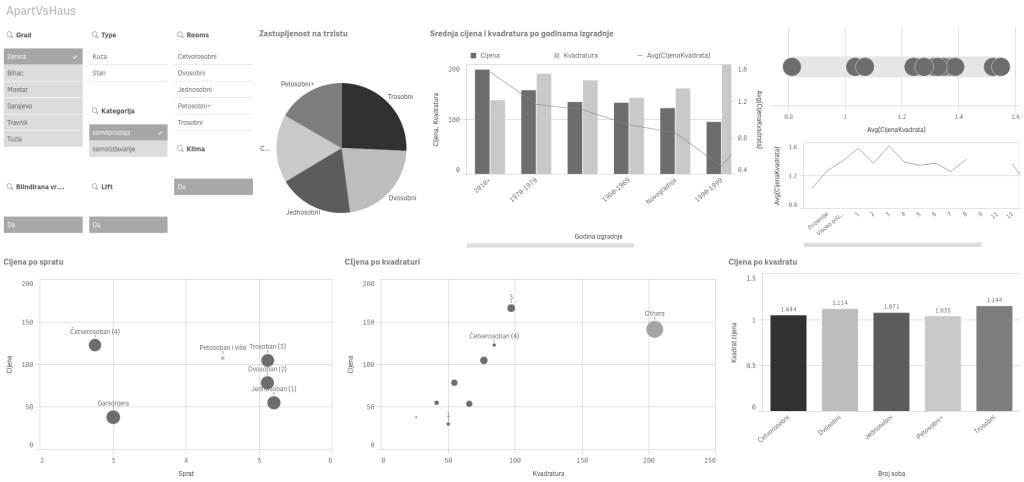
Gdje kupiti, iznajmiti ili prodati nekretnine u Bosni i Hercegovini. Ova vizuelna prezentacija ce vam pomoci oko nekih bitnih pitanja. Izvolite…
-
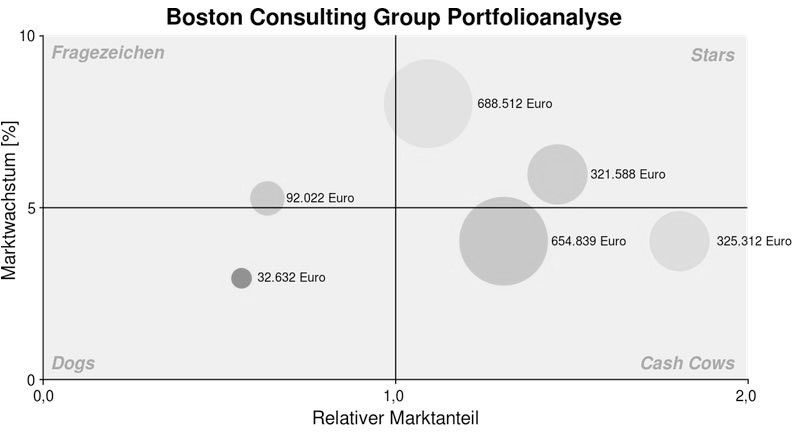
Recently, I had to make a Boston Consulting Group Matrix for a Strategic Management Class. I started off by doing everything in Python (Product-line growths etc.) and wanted to make a nice plot, but, plotting BCG Matrix in Python is a bit overhead and I switched to QlikView eventually, which I wanted to try out…
-

There is a life beyond regression analysis! You can do so much more with pure time-series data! #datascience #plotly #timeseries
-
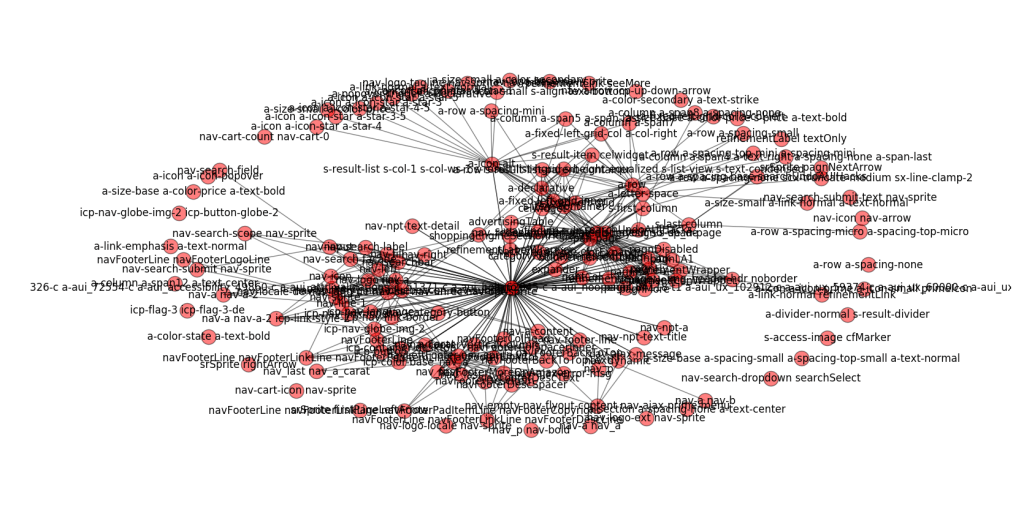
I was just working on some ‘side projects’ and made some nice visualizations of CSS classes as graph structures from Amazon, The New York Times and some other sites. Some interesting clusters can be spotted. Somehow, I have a feeling, I’m gonna dig deeper into this things of WebMining… Check out the plots below. Cheers!…
-
As the end of year 2016 is approaching, I decided to gather and summarize my visualizations on one page. Have a look. Visual Gallery Happy new year! Cheers! #visual #analytics #bigdata #BI #ML #datamining #mmds #plots Post by @dzhamzic. Source: Visual Gallery
