Some nice & new visualizations dzhamzic on August 10, 2018 
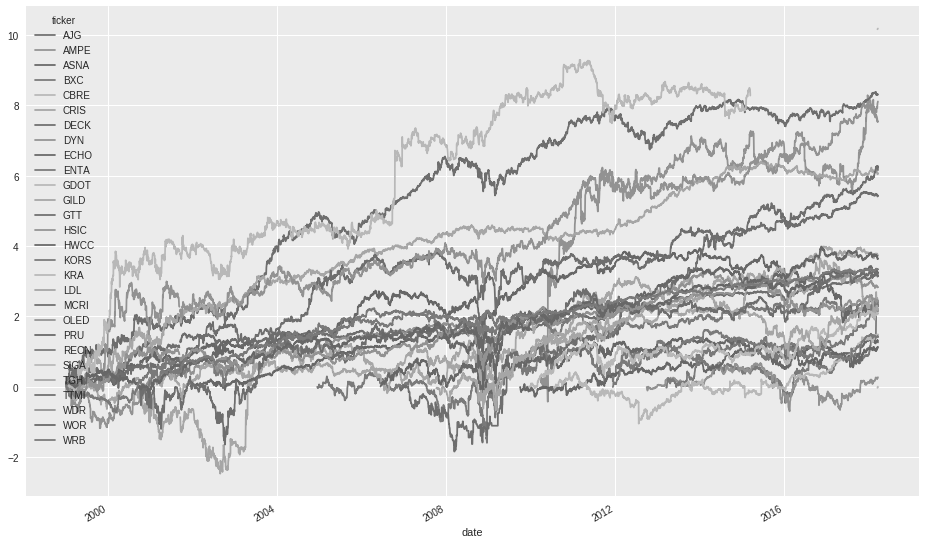
I love plotting data and learning from the visualizations. Here are some new data plots of projects I was working on lately. Like this:Like Loading... Category: Data Science, Finance, Python, Visualization Tag: #visualizations, Finance, Python Post navigation Previous: Previous post: Vizuelna Analiza Trzista Nekretnina Bosne i HercegovineNext: Next post: The power of Visual Data Science. Share this:TweetMoreWhatsAppEmail Published by dzhamzic bits & notes View all posts by dzhamzic Leave a comment Leave a Reply Cancel reply Enter your comment here... Fill in your details below or click an icon to log in: Email (required) (Address never made public) Name (required) Website You are commenting using your WordPress.com account. ( Log Out / Change ) You are commenting using your Facebook account. ( Log Out / Change ) Cancel Connecting to %s Notify me of new comments via email. Notify me of new posts via email. Δ