Python
-

Coronavirus (COVID-19) outbreak brought the world economy and the stock market to their knees. Many people and most companies are fighting to survive these hard times. On the other hand, some are using this situation to make huge profits. In this experiment I demonstrated how to make over 80% gains, while the stock market is…
-

Today, as data volumes are growing almost exponentially, search in artificial intelligence and computer science is regaining it’s popularity. There is basically no field without application of at least some of the search algorithms. Many of these search algorithms in computer science and artificial intelligence rely heavily on graphs and trees as underlying data structure…
-
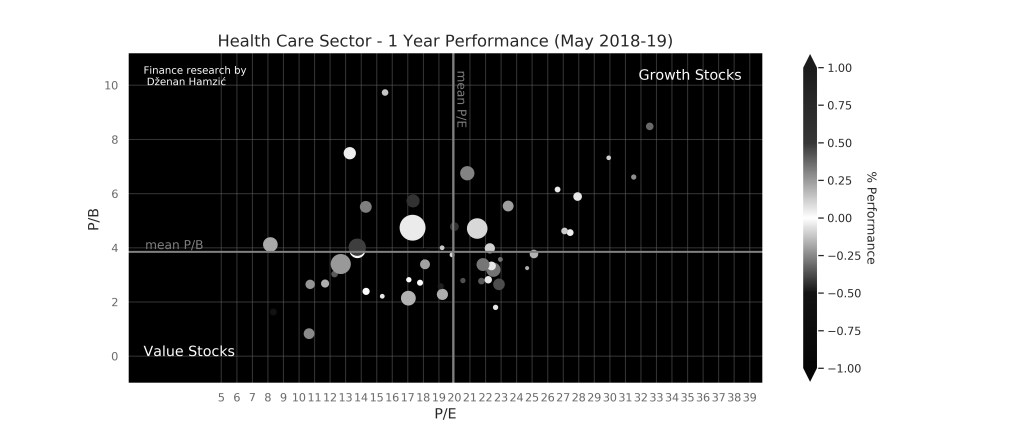
I always asked myself how to visualize stock performance by sector properly. It is a fact that Visualization is underrated in the field of Quantitative Finance. So here is my contribution to the Visualization Techniques for Quantitative Finance.
-
It all starts with a single neuron! Or with a perceptron. Perceptron is a neuron’s computational model. If you link some of them together, you get to a real ‘artificial brain’ capable of learning complex stuff. When I try to explain basic AI concepts to non computer scientist, I usually start like this … You…
-
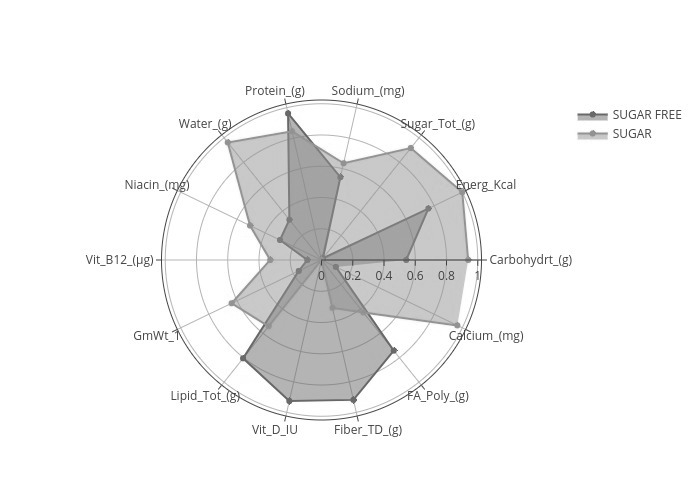
When I do not deal with people, machines or numbers, I enjoy the pleasures of data visualizations. #VisualThinking #DataScience #Python
-
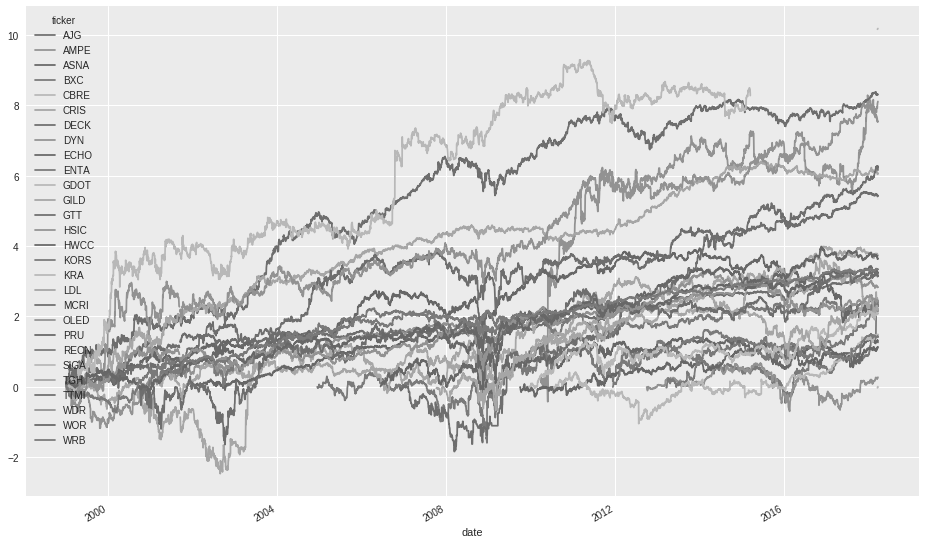
I love plotting data and learning from the visualizations. Here are some new data plots of projects I was working on lately.
-
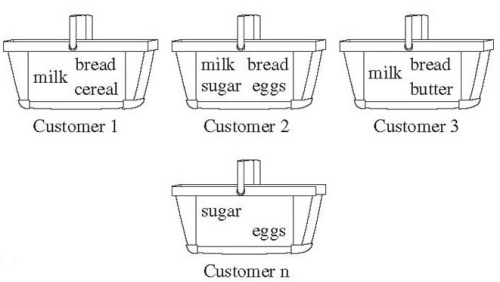
Have you ever asked yourself how the store managers decide on product shelf placement in retail stores? There must be some strategy behind it, right? It can’t be just a random choice. Almost on daily basis, you receive product purchase recommendations from variety of sources where you have left your “digital fingerprint”. In many cases these…
-

The title might also have been, “how to reduce 10 Gb of data to 1 single Megabyte”. BigData is only going to get bigger in the future. Our challenge, among others, is to find efficient methods and algorithms to (quickly) deal with wast amounts of data, extract meaningful information and to find ways how to…
-

The Amazon and Netflix are making almost 50% of their revenues by recommending appropriate products (books, movies) to their users. But how do they know what to recommend to their users? Well, they use the power of the collaboration between all other items and users. btw… If you would like to go deeper into the…
-

Maybe the easiest way to connect to Twitter API and to stream tweets, is using Python and Tweepy. You can install Tweepy using pip: Tweepy is an open source library and you can check the source here. Maybe, take a peak at StreamListener class and see what additional options are available. ‘Nuff said. Here’s the…
-

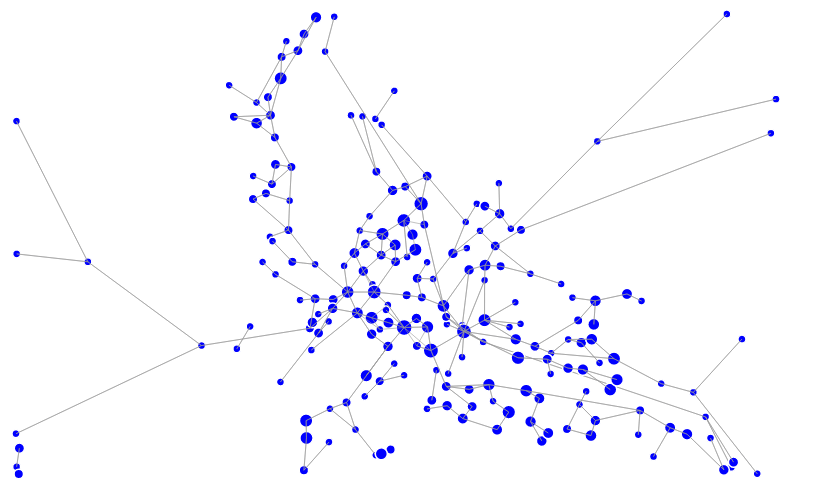
Have you ever asked yourself how google ranks the pages when you search something on google.com? If yes, have a look at PageRank algorithm definition. I’ll not go into much details here, but to give you an idea, the World Wide Web can be seen as a large graph, consisting of pages as nodes and…
-

Using pure selenium methods to extract data from metasearch websites is quite tricky and uses a lot of CPU resources. I have spent significant amount of time with selenium built-in methods with python and have a feeling that the development is quite tedious, time consuming and prone to bugs. Selenium’s WebElement objects are not flexible,…
-
Which vertices in graph can be reached in 1, 2 or N hops? This can basically be implemented in two ways. First, if the graph is implemented as adjacency matrix, by checking connections (ones in double array or a row) and iterating further. Second, if the graph structure is implemented as ArrayList, by checking lists of…
-

Continuing to the previous post this script distributes missing values across all features in Pandas DataFrame. Just set min and max missing value distribution and you’re ready to execute … Enjoy…
-
If you want to test how Maschine Learning algorithms perform with missing values you may need a script to distribute a fixed percentage of missing values in a feature. This script randomly distributes missing values in a single data set’s column. Enjoy…
