Big Data
-
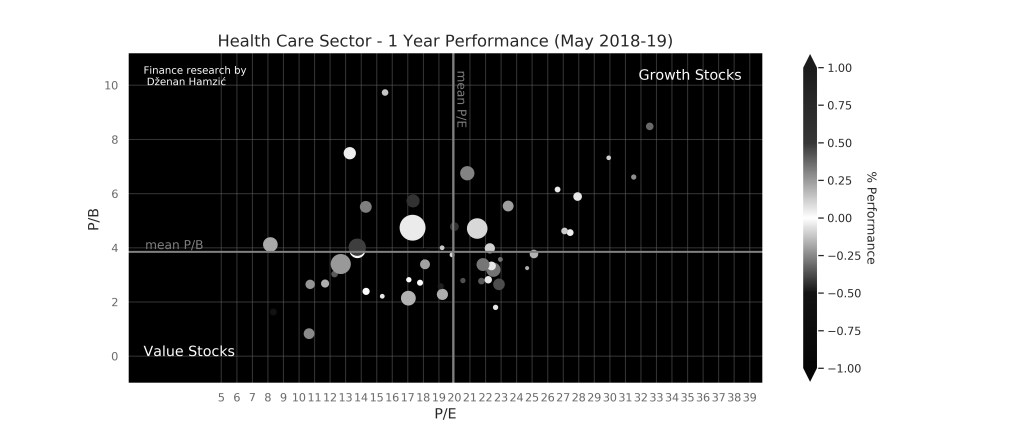
I always asked myself how to visualize stock performance by sector properly. It is a fact that Visualization is underrated in the field of Quantitative Finance. So here is my contribution to the Visualization Techniques for Quantitative Finance.
-
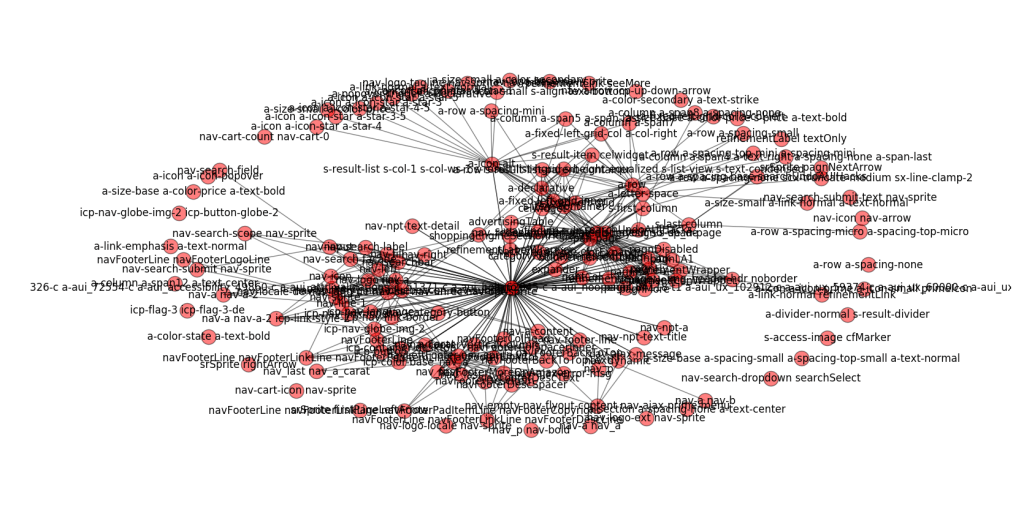
I was just working on some ‘side projects’ and made some nice visualizations of CSS classes as graph structures from Amazon, The New York Times and some other sites. Some interesting clusters can be spotted. Somehow, I have a feeling, I’m gonna dig deeper into this things of WebMining… Check out the plots below. Cheers!…
-
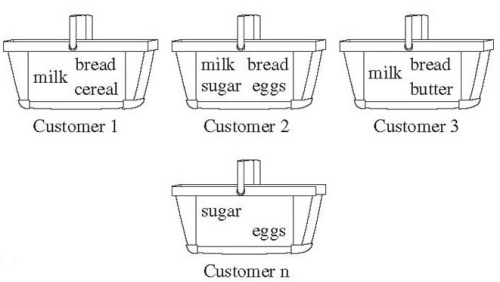
Have you ever asked yourself how the store managers decide on product shelf placement in retail stores? There must be some strategy behind it, right? It can’t be just a random choice. Almost on daily basis, you receive product purchase recommendations from variety of sources where you have left your “digital fingerprint”. In many cases these…
-

The title might also have been, “how to reduce 10 Gb of data to 1 single Megabyte”. BigData is only going to get bigger in the future. Our challenge, among others, is to find efficient methods and algorithms to (quickly) deal with wast amounts of data, extract meaningful information and to find ways how to…
-

Maybe the easiest way to connect to Twitter API and to stream tweets, is using Python and Tweepy. You can install Tweepy using pip: Tweepy is an open source library and you can check the source here. Maybe, take a peak at StreamListener class and see what additional options are available. ‘Nuff said. Here’s the…
-

Have you ever asked yourself how google ranks the pages when you search something on google.com? If yes, have a look at PageRank algorithm definition. I’ll not go into much details here, but to give you an idea, the World Wide Web can be seen as a large graph, consisting of pages as nodes and…
-

Back in 2015 i had to implement MapReduce job to extract top 15 hashtags from twitter’s raw data in Hadoop. This was a part of Business Intelligence lecture exercise at Vienna University of Technology. Regex used (not the best one by my opinion), for hashtag extraction, has following format: String regex = “text\”:\\\”(.*)\\\”,\”source”; The ‘source’ field comes…
